Conversion analytics helps you track and analyze user behaviors within your customer journey. By setting up conversion tracking events, you can monitor how customers engage with your business and measure key performance indicators. This feature enables you to optimize sales funnels, improve engagement strategies, and refine marketing efforts.
In this article, we will guide you through setting up your Conversion Analytics Dashboard, including the guide to the following steps:
- Creating and managing conversion tracking events
- Logging conversion events in Flow Builder
- Adding tracking events to the Conversion Analytics Dashboard
Creating and managing conversion tracking events
Before logging any conversion events, you need to set them up for tracking user behaviors. You can create, manage, and modify these events within your workspace.
Creating conversion events
Note: These features and configurations are available only to users with the appropriate permissions. For further details, refer to our Help Center article on Roles and permissions.
You can follow the steps below to create conversion tracking events:
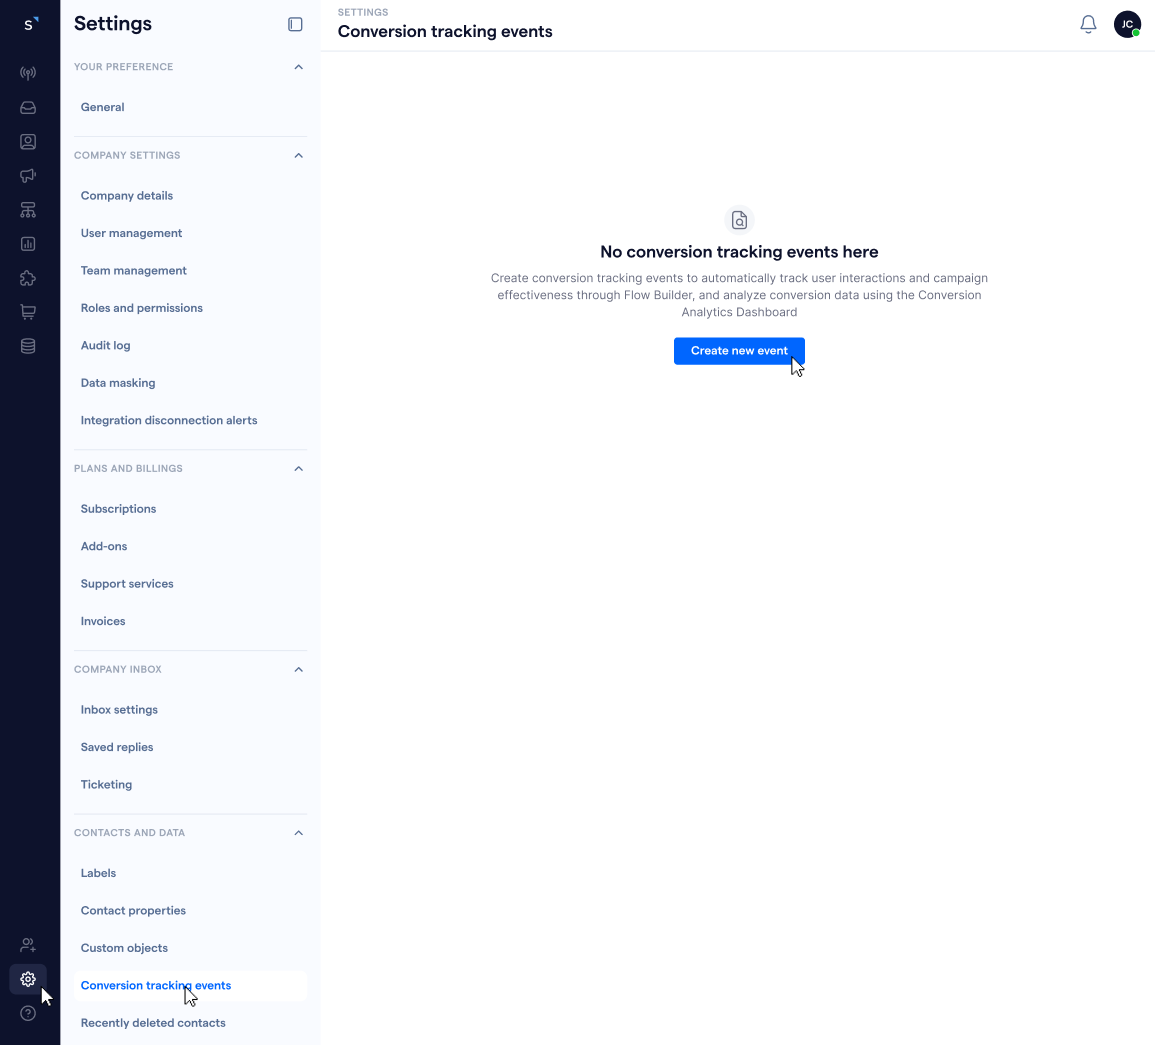
- Click the
icon in the left-navigation bar to go to the Settings page
-
Under “Contacts and data”, click “Conversion tracking events”
- You will be redirected to the “Conversion tracking events” settings page
- To create your first conversion tracking event, click “Create new event”
-
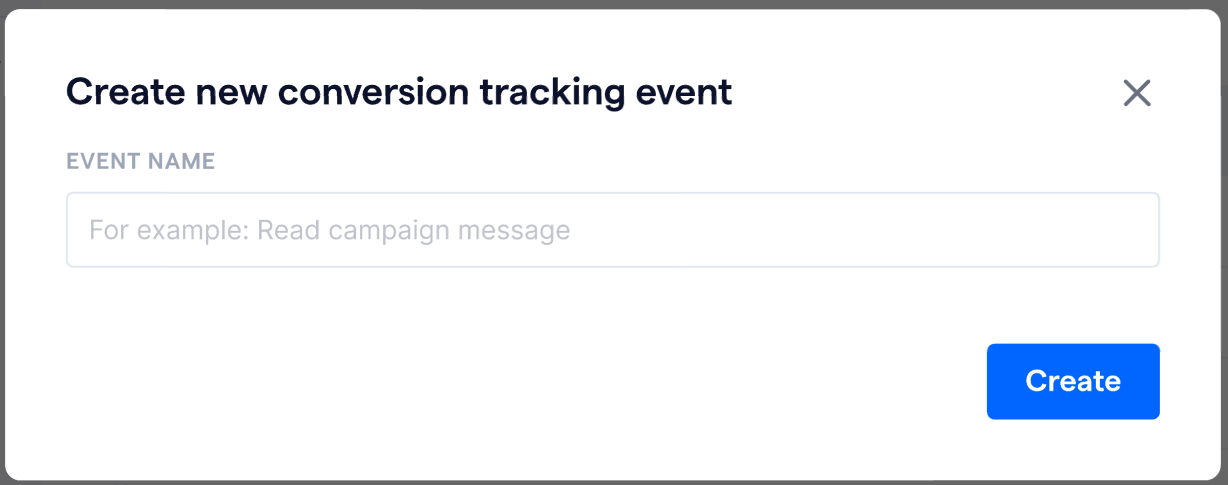
A “Create new conversion tracking event” pop-up modal will appear
- Enter a unique event name to easily identify each conversion tracking event in your workspace
-
Click “Create”
Note: You can create up to 100 events in your workspace.
Managing conversion tracking events
You can manage existing conversion events to keep your tracking organized. In the “Conversion tracking event” settings page, you can rename existing events or delete existing ones.
Renaming conversion tracking events
You can follow the steps below to rename an existing conversion tracking event:
- In the “Conversion tracking event” settings page, locate the event that you need to rename
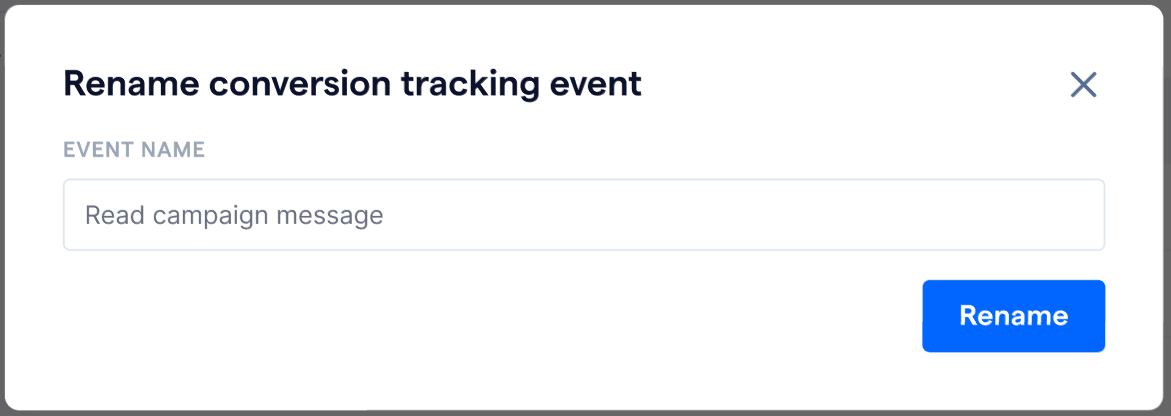
- Click the icon on the right side of the event name
-
A pop-up modal will appear
- Fill in the new name and click “Rename” to save the change
Deleting conversion tracking events
You can follow the steps below to delete an existing conversion tracking event:
- In the “Conversion tracking event” settings page, locate the event that you need to delete
- Click the
icon on the right side of the event name
-
A warning message will appear
-
Click “Delete” to confirm
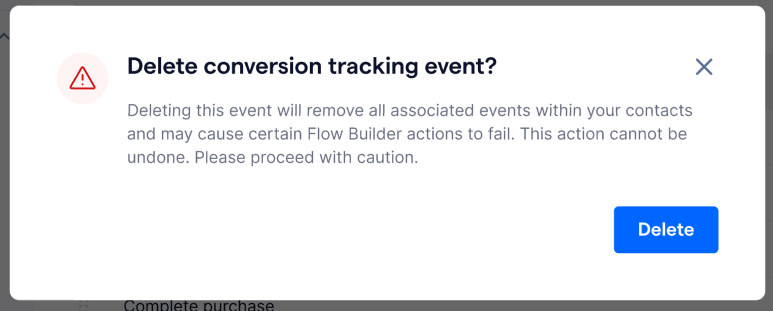
Important: Deleting an event will remove all associated event records from your contacts, impact related Flow Builder actions, and prevent them from functioning properly. Additionally, the event data will no longer be displayed in the analytics dashboard. This action cannot be undone.
Logging conversion events in Flow Builder
After creating your conversion tracking events, you can set up a flow in Flow Builder to start logging them. To track user behaviors, use the “Log conversion tracking event” action node within your flow.
To add the “Log conversion tracking event” action node, you can:
- In Flow Editor, add a new node to the flow
- Click on “Action”
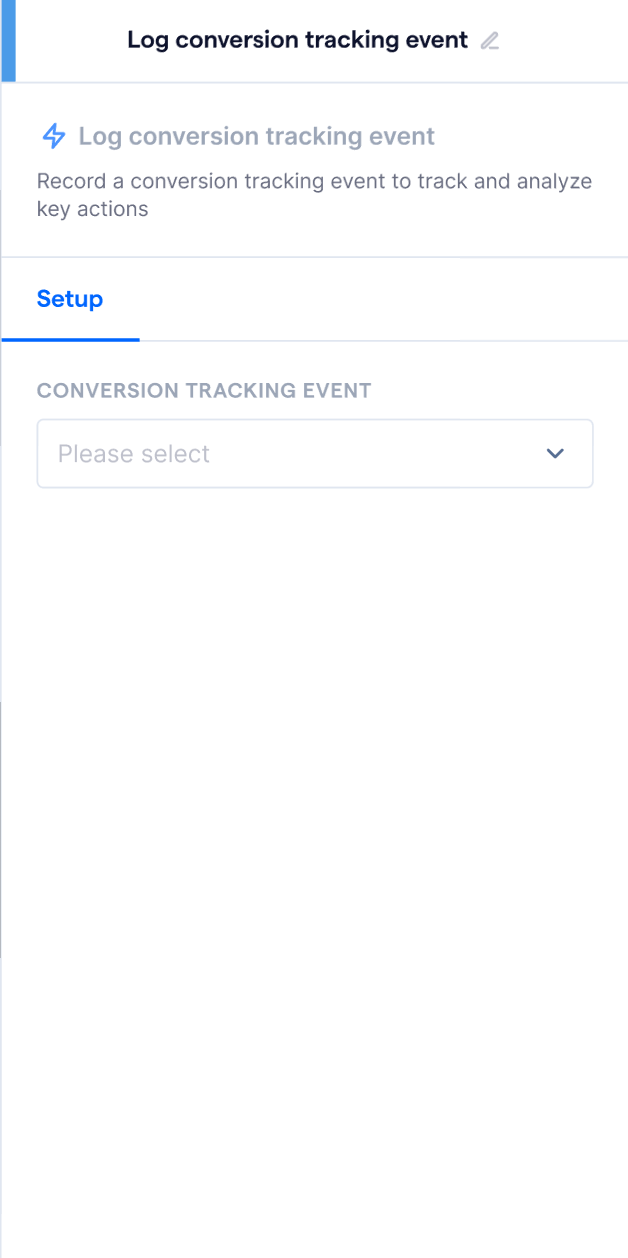
- Under “Lead conversion”, select “Log conversion tracking event”
-
It will open up its form, which will appear on the right side of the screen
-
Select the conversion tracking event you have created
Conversion Analytics Dashboard
The conversion analytics dashboard provides insights into user interactions and conversion rates. Once you have started logging conversion tracking events, you will be able to see the detailed metrics in the Conversion Analytics Dashboard, which consists of two key sections: Total conversions and Conversion rate.
Accessing the Conversion Analytics Dashboard
You can follow the steps below to access the Conversion Analytics Dashboard:
- Click the
icon on the left-navigation bar
-
A pop-up menu will appear. Select “Conversion”
-
You will be redirected to the Conversion Analytics Dashboard

“Total conversions” tab
The “Total conversions” tab helps you track the overall number of conversions recorded for selected events. In this tab, you can filter tracked conversion events and add conditions to narrow down the data.
Adding conversion tracking events
To view analytic data, you need to select at least 1 conversion tracking event for the dashboard. Follow the steps below to add conversion tracking events:
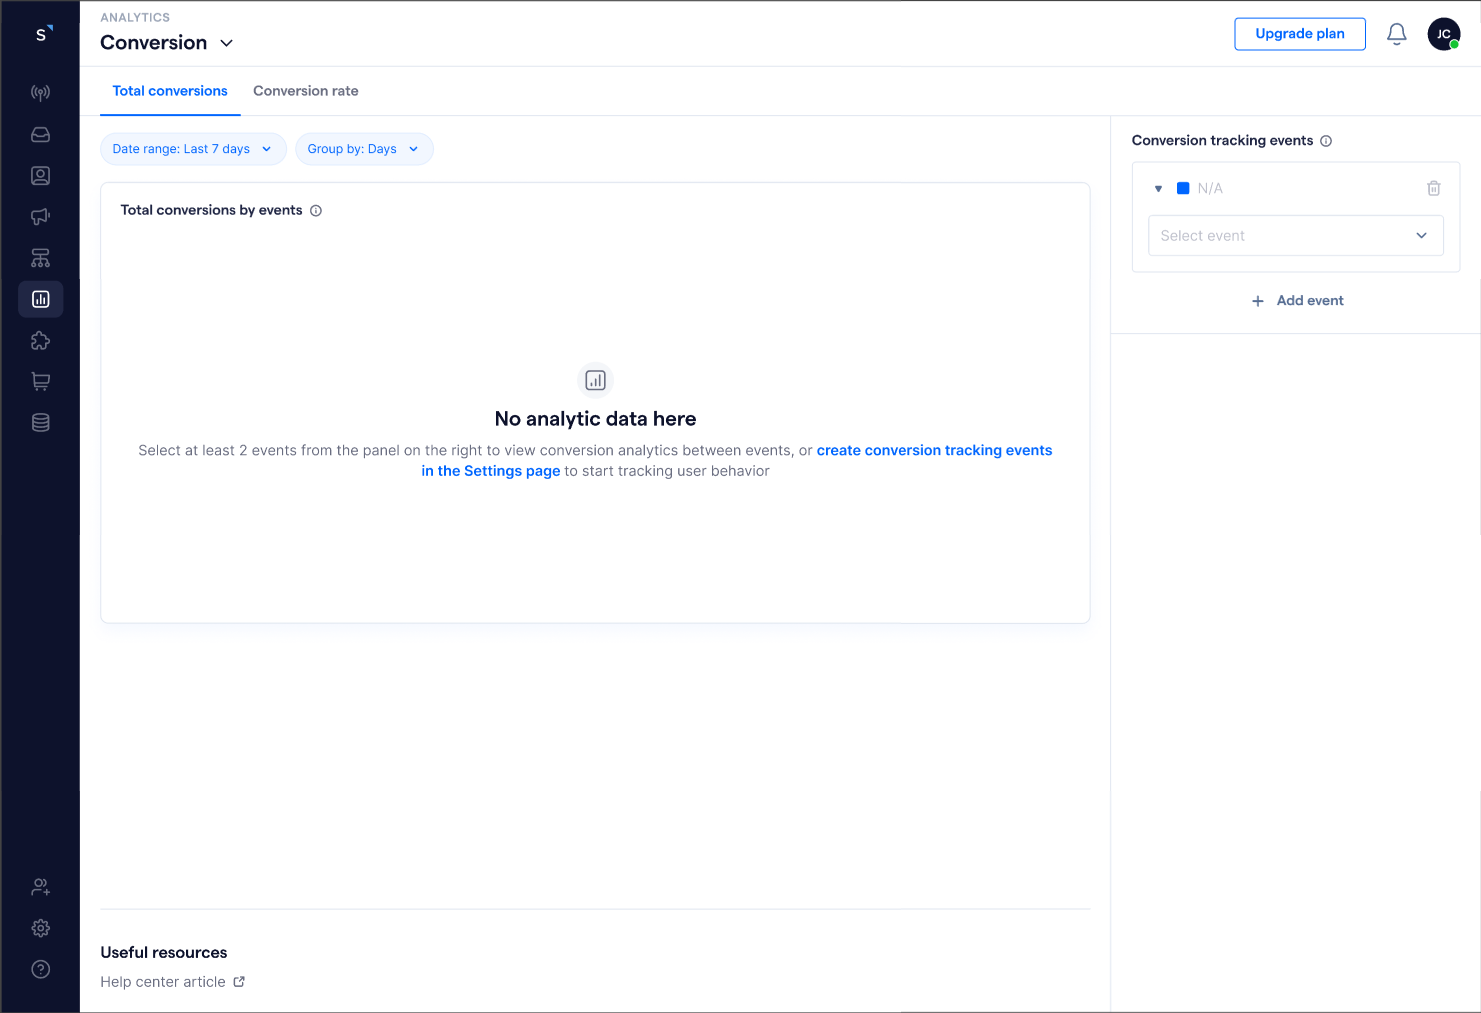
- In the “Conversion Analytics Dashboard”, go to the “Total Conversions tab”
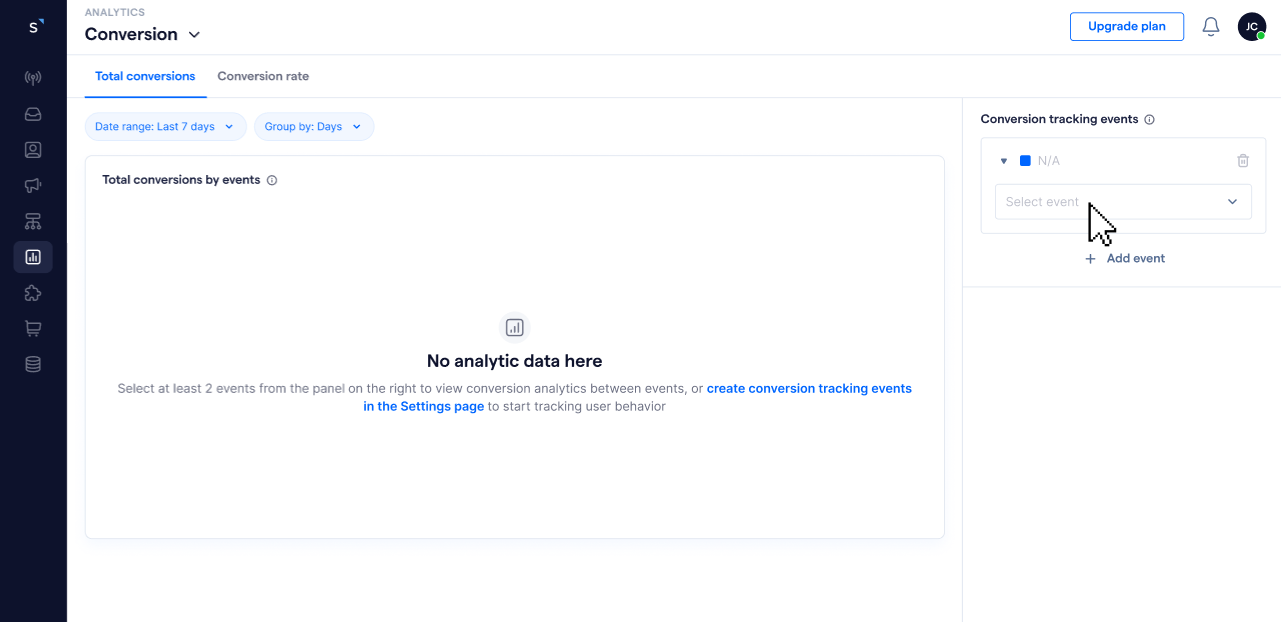
-
In the right-side panel, click on the “Select event” drop-down menu to select the first conversion tracking event. If you haven’t created a conversion tracking event, please refer to this section to create one
- Click “Add event” on the right side panel to add more. You can add up to 5 events for tracking at a time
-
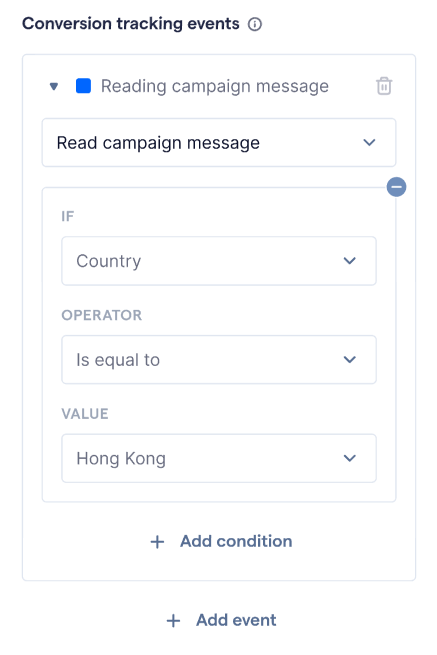
When you toggle open the event, you can add conditions to filter a more specific group of contacts you wish to track
- Once you have selected a conversion tracking event, the data will automatically appear in the left-side chart
-
If needed, you can click on the
icon on the right side of the event modal to delete a selected tracking event
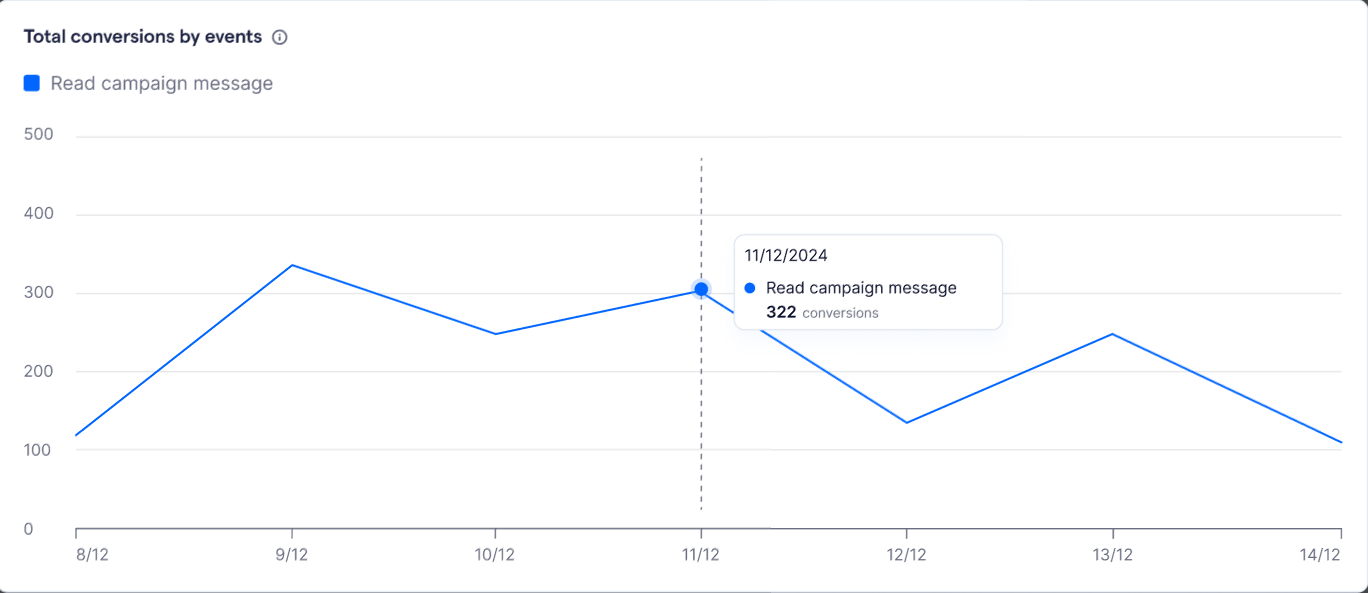
“Total conversions” chart
Once you’ve selected at least one event, data will be displayed in a line chart.

Here are what you can view in the “Total conversions” chart:
-
You can hover to a specific date to see the breakdown of the selected conversion tracking events numbers of that day
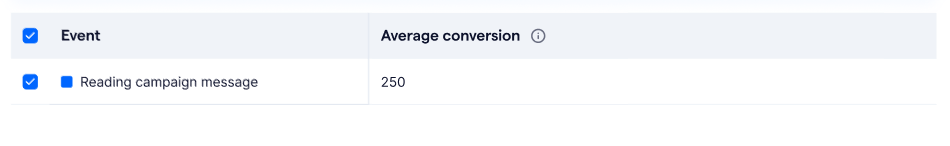
-
Below the line chart, you can view the events along with their average conversion rate, representing the average number of conversions per selected tracking event based on the chosen date range and data grouping
Tool bar
In the “Total conversions” tab, the default settings display data from the last 7 days, grouped by day. You can adjust the date range and grouping method to analyze and track data over different time periods in the tool bar section.
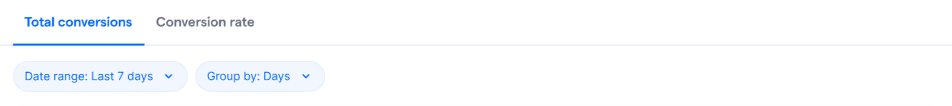
The following explains how each setting affects the way data is displayed:
- “Date range” determines the time period for which the conversion data is displayed. By selecting a different date range, you can analyze trends and performance over a specific timeframe.
- “Group by: defines how the data is structured within the selected date range. This allows you to view trends on a daily or weekly basis, making it easier to identify patterns.
Here are the available options:
-
Date range selection:
- Last 7 days: Data from the past 7 calendar days (excluding today).
- Last 14 days: Data from the past 14 calendar days (excluding today).
- Last 30 days: Data from the past 30 calendar days (excluding today).
-
Group by:
- Day: Displays data for each individual day within the selected date range.
- Week: Groups data into calendar weeks, helping to analyze performance on a weekly basis
“Conversion rate” tab
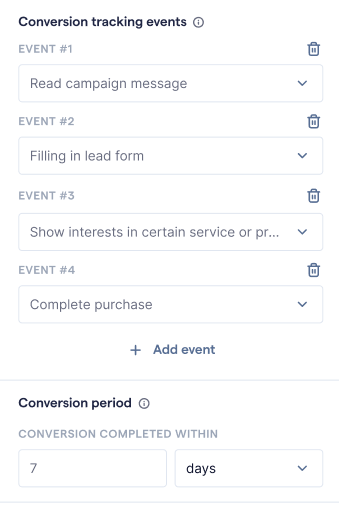
The “Conversion rate” tab provides a visual representation of how many contacts successfully complete all selected conversion events within the defined conversion period. To view data, you will need to add conversion tracking events to the dashboard, and apply conversion period to the metrics.
Adding conversion tracking events
To view “Total conversion rate” data, you will need to add at least 2 conversion tracking events to the dashboard. You can follow the steps below to add conversion tracking event:
- In the “Conversion Analytics Dashboard”, go to the “Conversion rate” tab
-
In the right-side panel, select the conversion tracking events by clicking the drop-down menu. If you haven’t created a conversion tracking event, please refer to this section to create one
- You can click “Add event” to add more tracking events to the dashboard. You can add up to 5 events for tracking at a time
- Once you have selected a conversion tracking event, the data will automatically appear in the left-side chart
- If needed, you can click on the

Applying conversion period
Once you have added conversion tracking events, you will need to apply a conversion period, which defines the time frame within which a user’s action is counted as a conversion. Any action taken outside of this period will not be counted.
Setting an appropriate conversion period helps ensure that your tracking aligns with your business goals - for example, measuring how long it takes for leads to convert after engaging with an event or assessing the effectiveness of follow-up actions within a specific timeframe.
You can follow the steps below to apply conversion period to your dashboard:
-
In the right-side panel, locate the “Conversion period” section
- Fill in the number for the conversion period. You can select “days”, “weeks”, or “months” as the unit
Tool bar
In the “Conversion rate” tab, the default settings display data from the last 7 days. You can adjust the date range to analyze and track data over different time periods in the tool bar section.
Here are the available options:
- Last 7 days: Data from the past 7 calendar days (excluding today).
- Last 14 days: Data from the past 14 calendar days (excluding today).
-
Last 30 days: Data from the past 30 calendar days (excluding today).
Understanding the relationship between “Conversion period” and “Date range”
To accurately track conversions, it’s important to understand how the date range and conversion period settings impact your data. The date range determines which users are included in the funnel, while the conversion period sets the time frame within which they must complete all steps to be counted as converted.
- Date range: Determines which users’ actions are displayed in the funnel, based on when they started their journey.
- Conversion period: Defines how long users have to complete all conversion steps to be counted as converted.
Example 1: Lead nurturing flow
- Conversion period: 30 days → Contacts have 30 days to complete all steps.
- Date range: Last 7 days → Only contacts who started within the last 7 days are included.
- If a contact started 10 days ago, they won’t appear in the chart, even if they convert later within 30 days.
Example 2: Tracking purchases
- Conversion period: 7 days → Contacts must purchase within a week of clicking a promo.
- Date range: Last 14 days → Shows contacts who clicked within the last two weeks.
- Impact: If a contact clicked 10 days ago and purchased today, they won’t be counted since their 7-day conversion period expired.
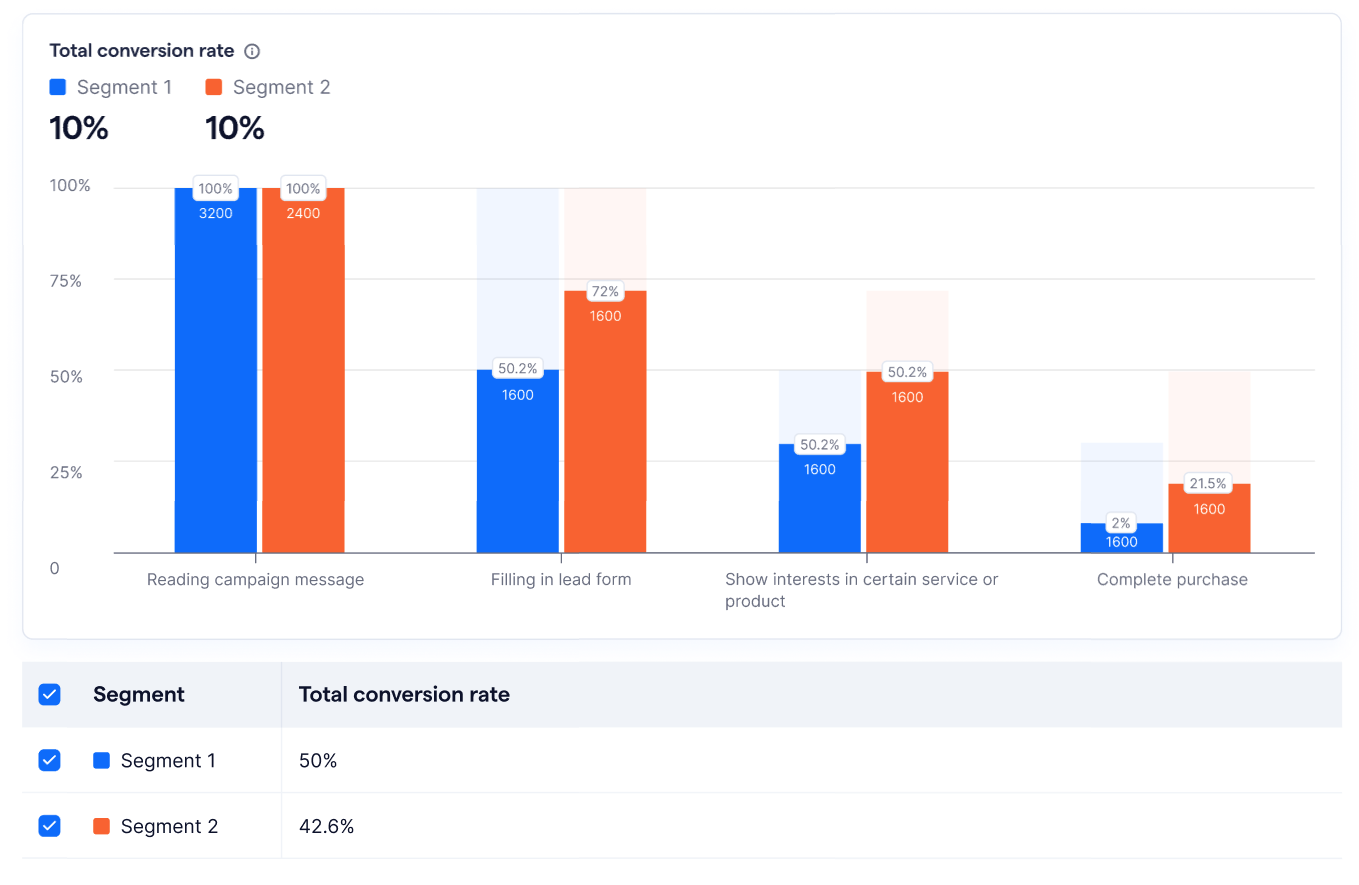
“Total conversion rate” chart
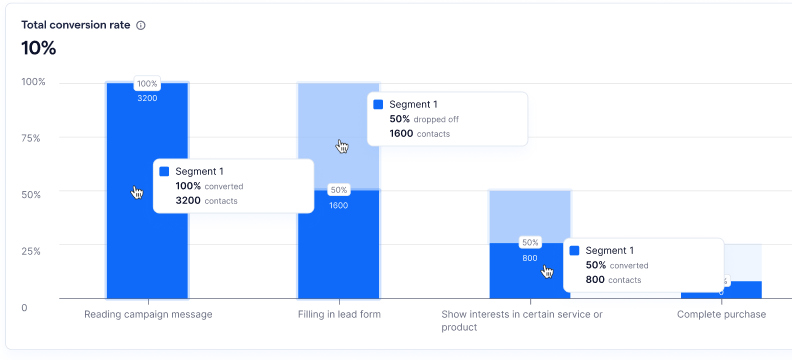
The bar chart visualizes conversion performance by showing the percentage of users who successfully completed all specified conversion events within the defined conversion period. This helps track user progression through each event stage and identify potential drop-offs.
Here’s how you can interpret the data in the bar chart:
- Total conversion rate: Displayed at the top of the chart, this represents the percentage of users who completed all tracked conversion events (starting from the first event) within the specified conversion period
-
When hovering over a darker blue bar:
- Conversion rate: The percentage of users who successfully completed that specific event
- Total number of contacts converted: The number of users who completed the event
-
When hovering over a lighter blue bar:
- Drop-off rate: The percentage of users who did not complete that event
- Total number of contacts dropped off: The number of users who exited at that stage
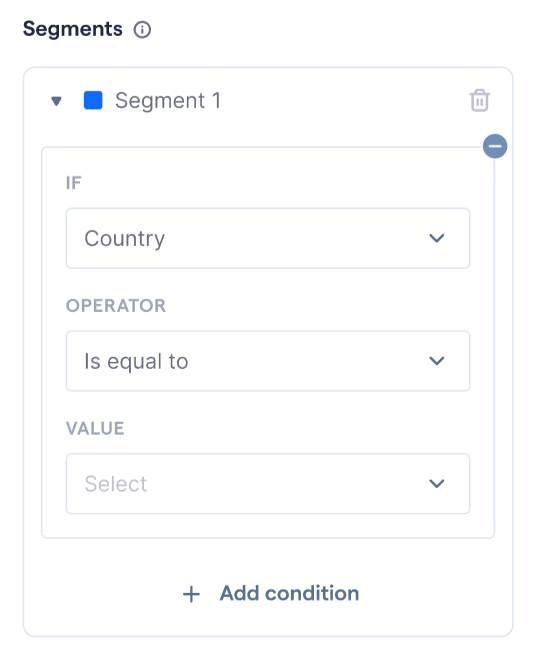
Applying segment(s)
Segments allow you to filter and analyze specific groups of contacts within your conversion data. By applying segments, you can compare performance across different audience types and gain deeper insights into user behavior. This helps you identify patterns, optimize campaigns, and tailor engagement strategies.
You can follow the steps below to apply segments to your dashboard:
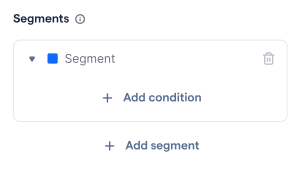
- On the right-side panel, locate the “Segments” section
-
Click “Add condition” to create your first segment
-
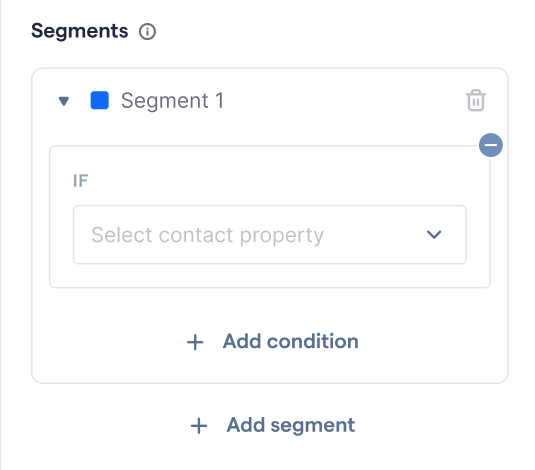
The “If” field will appear, allowing you to define conditions for your segment. Select a contact property as the condition for segmentation
-
Complete the condition setup by specifying the operator and value. You can also click “Add condition” to add more to the segment if needed
- To remove unnecessary condition, simply click the
icon at the top right corner of the conditional modal
-
As you define your segment conditions, the bar chart updates in real time, reflecting the selected segment
Note: You can create up to 5 segments at a time in the “Conversion rate” dashboard
Once you apply a segment, the following will be updated accordingly:
- Dashboard data and charts: The displayed data will only reflect users who belong to the selected segments.
-
Bar chart breakdown: You can view conversion rates specific to each segment, allowing for a clearer comparison of user journeys across different groups.