


The “Conversation Analytics Dashboard” provides valuable insights into your inbox performance, allowing you to monitor message volume and evaluate team or agent efficiency. This dashboard is designed to help you optimize communication workflows and enhance overall team productivity.
Key conversation terms
To understand the foundation of Conversation Analytics, you first need to be familiar with the following items and their definitions:
| Concept | Definition |
| Conversation history | The complete history of messages exchanged within a channel between your business and a contact since their first interaction. |
| Conversation | A set of messages exchanged within a specific channel between your business and a contact within a calendar day. |
| Engaged conversations | A conversation that includes at least 1 incoming message from the contact within a calendar day. |
| Start of conversation | A conversation is considered started upon the first message sent or received within a conversation history on a calendar day. |
| End of conversation | A conversation is considered ended at the close of the calendar day. |
🕒 Note: A calendar day refers to a 24-hour period from 00:00 to 23:59 based on your workspace’s timezone setting.

Accessing Conversation Analytics Dashboard
You can follow the steps below to access the Conversation Analytics Dashboard:
- On the left navigation bar, click on the
icon
- A menu will appear, click on “Conversations” to go to the Conversation Analytics Dashboard
- You will be redirected to the Conversation Analytics Dashboard
Conversation Analytics Overview
In the Conversation Analytics Dashboard, you will see different sections, including:
In the sections below, we will be introducing different sections and the definitions of different metrics available on the Conversation Analytics Dashboard.
Tool bar

Under this section, you can explore and apply various filters to customize the data displayed in the Conversation Analytics Dashboard. By default, the filter is set to display data from the past 14 days, grouped by “Days.” Once the filters are applied, they will update the data shown in the Conversation Analytics Dashboard.
To learn more about the filters available, please refer to this section.
Metrics card
In the “Metric card” section, you will see the following metrics:
| Metric | Definition |
| Engaged conversations | Total number of conversations with at least 1 incoming message from the contact within a calendar day |
| New inquiries | The total number of conversations initiated by incoming messages within a calendar day during the selected date range |
| Average reply time | The average time it takes for a human agent to reply to messages in a conversation within the selected date range. Working hours settings apply. |
Conversations
The “Conversations” section offers insights into the volume and traffic of your conversations. Here, you can track the following metrics by date:
| Metric | Definition |
| Total conversations | Total number of conversations with at least 1 successful outgoing message or incoming message within a calendar day during the selected date range |
| Engaged conversations | Total number of conversations with at least 1 incoming message from the contact within a calendar day |
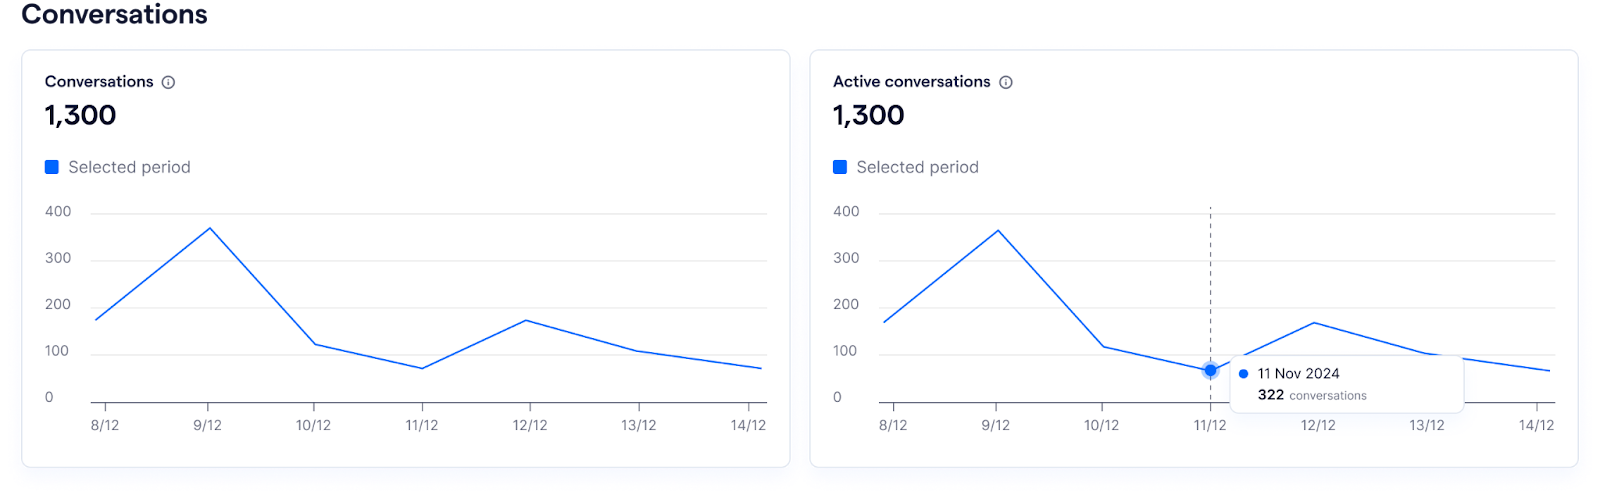
Note: Imported conversations are excluded in these metrics.
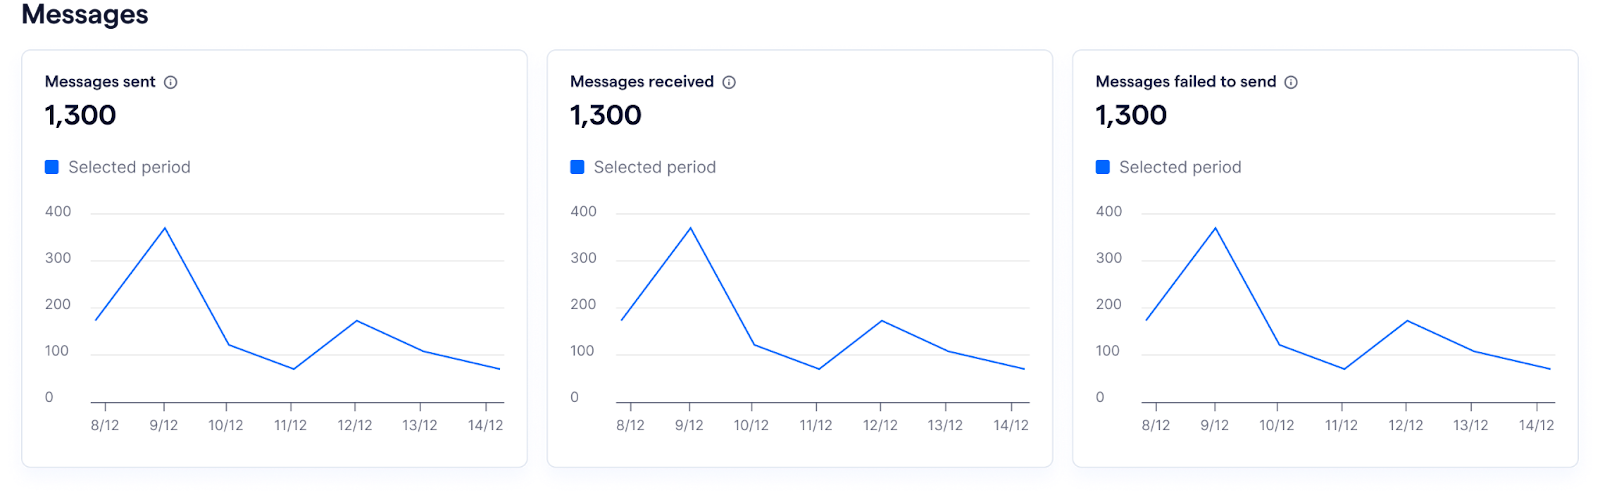
Messages
Note: Imported conversations are excluded in these metrics.
The “Messages” section provides an overview of message status volumes. You can track the following metrics by date:
| Metric | Definition |
| Messages sent | The total number of outgoing messages sent by a human agent within the selected date range |
| Messages received | The total number of incoming messages from your contacts within the selected date range |
| Messages failed to send | The total number of outgoing messages sent by a human agent that failed to send within the selected date range. |
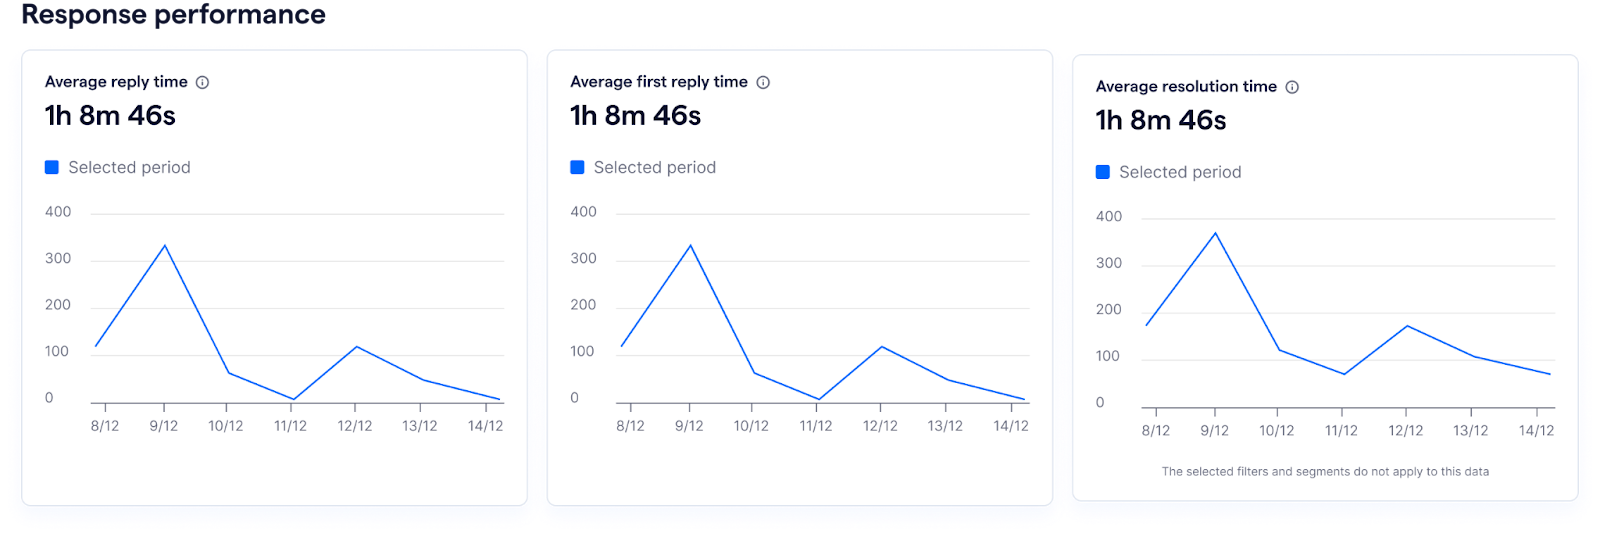
Response performance
The “Response performance” section offers an overview of overall response efficiency. In this section, you can track the following metrics by date:
| Metric | Definition |
| Average reply time | The average time it takes to reply to messages in a conversation within the selected date range. Working hours settings apply. |
| Average first reply time | The average time it takes to reply to the first message in a conversation. Working hours settings apply. |
| Average resolution time | The average time between when a conversation is marked as "Open" and when it is marked as "Closed." This metric is not affected by filters or working hours settings. |


How first response time is calculated when AI agent is enabled
Average first response time is calculated based on the first reply sent from the business side, regardless of whether the reply is sent by:
- A human agent
- An AI agent
- An automated message triggered by a predefined flow (e.g. a message sent through Flow Builder).
This means that if an AI agent responds immediately after a customer’s first message, the first response time will be calculated based on that AI reply, even if a human agent replies later.
Example
10:00 – Customer sends the first message
10:01 – AI Agent replies
10:10 – Human agent takes over and replies
In this case:
- First response time = 1 minute (10:00 → 10:01)
- The human reply at 10:10 does not affect first response time
If you would like to measure response time from human agents only, you can apply filters in Analytics to include only selected human agents.


Note: Automated messages will not impact the “Response performance” metrics.
Applying working hours settings in Response performance metrics
If you have enabled and configured working hours, the average reply time and average first reply time metrics will be calculated based on your defined working hours. The working hours and calendar day act as a cut-off timeframe for these calculations.
Working hours settings enabled
Scenario 1: Within working hours
- A customer sends a message at 5:50 PM on Monday.
- A team member replies at 5:55 PM on the same day.
- Response time: 5 minutes.
Scenario 2: Response partially outside working hours
- A customer sends a message at 5:50 PM on Monday.
- A team member replies at 6:30 PM on the same day (30 minutes after working hours).
- Response time: 10 minutes (time outside of working hours is not excluded).
Scenario 3: Message and response entirely outside working hours
- A customer sends a message at 7:00 PM on Monday.
- A team member replies at 7:30 PM on the same day.
- This response time will be discarded. Messages received and replies sent entirely outside working hours or those replied to the next calendar day are not included in the calculation.
Scenario 4: Message outside working hours, reply in next working day
- A customer sends a message at 3:00 AM on Tuesday.
- Business hours: 9:00 AM – 6:00 PM.
- A team member replies at 9:10 AM on Tuesday.
- Response time: 10 minutes (calculated from the start of business hours).
Note: If “Working hours” settings is enabled and included in the dashboard, a visual indicator will display the last time the business hour settings were updated. This helps ensure that data reflects the most recent operational hours.

Working hours settings disabled
If working hours are not enabled:
- No cut-off time is applied, and metrics are calculated for all responses within the same calendar day.
- However, any response time involving messages received and replied to across different calendar days will be excluded from the calculation.
You can visit our Help Center article here to learn more about working hours settings.
⚠️ Important: Working hours data is only collected after the setting is enabled
If you turn on the “Working hours” setting, SleekFlow will begin collecting data for reply time calculations based on your configured business hours from that moment onward.
Any data before the setting was enabled will not be available in the dashboard. You can still access your historical data without business hour by excluding it in the filter tab.
The working hours filters help display metrics based on business hours, but the metrics themselves can only be calculated once data collection starts.
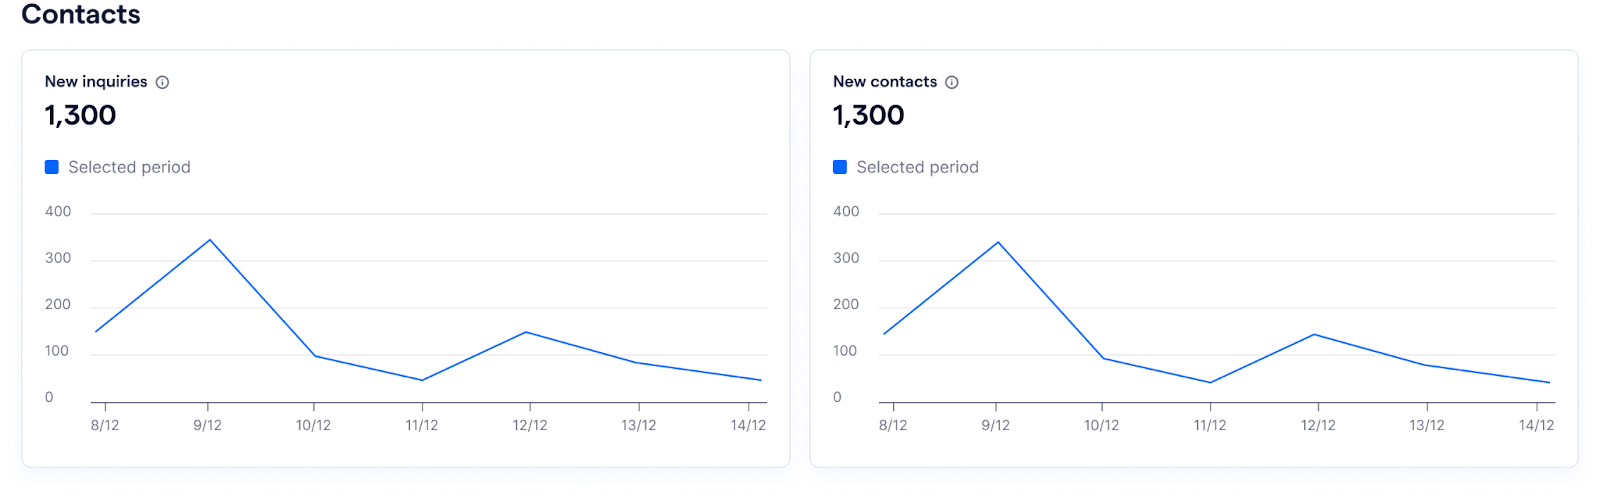
Contacts
Note: Imported contacts are excluded in the “Contacts” metrics.
The “Contacts” section offers insights into new inquiries and contact volume. In this section, you can track the following metrics by date:
- New inquiries: The total number of conversations initiated by incoming messages within a calendar day during the selected date range
-
New contacts: The total number of new contacts added during the selected date range, limited to those with no prior records stored in SleekFlow.
Broadcasts
The “Broadcasts” section offers insights into the performance of your broadcasts. In this section, you can monitor:
-
In the metrics cards:
- Delivery rate: The percentage of broadcast messages successfully delivered out of the total messages sent during the selected time period
- Bounce rate: The percentage of broadcast messages that failed to deliver out of the total messages sent during the selected time period
- Read rate: The percentage of broadcast messages read by recipients out of the total messages sent during the selected time period
-
Reply rate: The percentage of responses received from recipients out of the total messages sent during the selected time period
-
In the “Message by status” chart:
You can view the total number of broadcast messages by its status- Sent: The total number of broadcast messages sent
- Delivered: The total number of broadcast messages successfully delivered
- Bounced: The total number of broadcast messages failed to deliver
- Read: The total number of broadcast messages that has been read by the recipient
Replied: The total number of broadcast messages that received a reply (incoming message) within the same calendar day

Note: Filters and segments are not applicable to this section.
Working with Conversation Analytics
The Conversation Analytics Dashboard allows you to customize and refine your view using various tools and settings. Below is a detailed guide to help you navigate and apply these settings effectively.
1. Apply date range
Select your desired time period to analyze the conversation data.
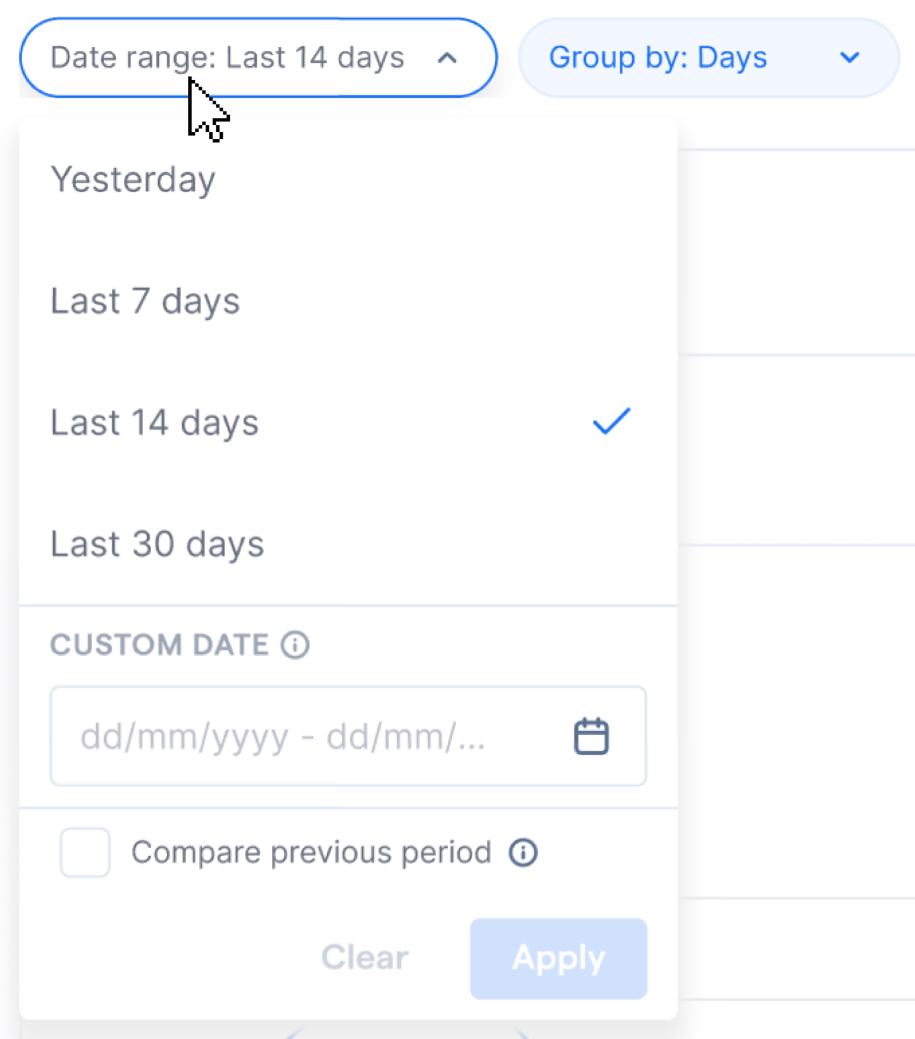
Use the date range field in the toolbar to choose from these default options:
- Yesterday: Data from the previous calendar day.
- Last 7 Days: Data from the past 7 calendar days (excluding today).
- Last 14 Days: Data from the past 14 calendar days (excluding today).
- Last 30 Days: Data from the past 30 calendar days (excluding today).
You can also select a custom time period of up to 180 days by clicking the custom date field.
Note: Some historical data may not be fully available due to limitations in data migration
2. Apply previous period comparison
Enable a time comparison by checking the “Compare previous period” checkbox under the date range field. The comparison period will match the length of the selected date range.

The dashboard will display data and charts for both the selected date range and the previous period.
Note:
- If segments are applied, the previous period comparison cannot be enabled, and vice versa. To use this comparison, remove any segment filters.
- Some historical data may not be fully available due to limitations in data migration
3. Apply “Group by” filter
Decide how to display your data in the charts based on time intervals.
You can choose from the following options:
- Day
- Week (formatted by calendar weeks)
- Month (formatted by calendar months)

The selected grouping will be applied to the dashboard’s line charts.
Note: This option is not applicable to metric cards and the broadcast section.
4. Apply Working hours
ℹ️ Note: Data for working hours metrics will only be available from the time you enable the setting. Past data will not be backfilled. you can still access your data prior to the business hour enabling by filtering it out in the filter tab
Apply “Working hours” to the calculation of your metrics. Under this setting, you can choose whether to include or exclude working hours when calculating response performance metrics. This flexibility allows you to analyze data based on your specific needs:
- Include working hours: Average response time and average first response time will be calculated based on your configured business hours.
- Exclude working hours: Metrics will be calculated without considering business hours, reflecting all response times regardless of working hours.
Note: If “Working hours” settings is enabled and included in the dashboard, a visual indicator will display the last time the business hour settings were updated. This helps ensure that data reflects the most recent operational hours.
If you haven’t configured “Working hours” settings yet, you can set them up to ensure response performance metrics accurately reflect your working schedule. You can go to the Settings page and set it up. For more information, please refer to our Help Center article on “Working hours” settings.
Note: These features and configurations are available only to users with the appropriate permissions. For further details, refer to our Help Center article on users and permissions.
5. Apply filters
Use “ filters” to narrow down your data by specifying properties, rules, and values.
ℹ️ About agents, contact owners, and filters
Agent
- Refers to the SleekFlow teammate who replied in a conversation.
- Even if the teammate is not the permanent contact owner (e.g. temporarily covering a colleague’s chat), any replies they send will still be counted toward that selected agent when filtering by Agent.
- Performance metrics like average response time include all conversations where this agent sent at least one reply.
Contact owner
- Refers to the teammate assigned to manage a contact in SleekFlow.
- This property stays the same unless manually reassigned.
- Useful for tracking long-term ownership of leads or customers.
- For performance metrics, only the contact owner’s replies are reflected.
Key difference
- Agent = Who handled or replied in the conversation (including temporary backup).
- Contact owner = Who is responsible for the ongoing relationship with the contact.
Example usage
- To measure support team teammates responsiveness: filter by Agent = [teammate’s name].
- To track sales rep ownership: filter by Contact property → Contact owner = [teammate’s name].
You can follow the steps below to apply “ filters”:
- Click the Filter button to open the filter settings.
- Choose the property you wish to use for filtering:
-
Agent
- You can select the contact owner of a conversation in the following metrics:
- Conversations
- Active conversations
- New inquiries
- New contacts - You can select a team member of the conversation in the following metrics:
- Average first response time
- Average response time
- Message sent
- Message failed
- You can select the contact owner of a conversation in the following metrics:
-
Channels
You can apply filters to the channels you have connected in SleekFlow -
Channel type
You can apply filters to the type of channels you have connected in SleekFlow. For example, WhatsApp Business API, Instagram, Facebook Messenger, etc. -
Contact properties
You can select contact properties as filter conditions
-
Agent
- Define the rule for your filter:
- Is any of - the system will include all values that meet any of the specified criteria
- Is not any of - the system will exclude all values that meet any of the specified criteria
- Select values for the chosen property and add up to 5 conditions.
- Use operators (AND or OR) to connect conditions. The first operator applies to all conditions in the filter.
- After adding all conditions and details, click “Apply” to execute the search or save the filter as a segment for future use. Once saved, the segment will be created and automatically applied to the dashboard.

Once applied, the dashboard data and charts will update based on the selected filters. To remove filters, click “Clear” in the Apply Filters dialog or use the “Reset” button on the toolbar.


Note: Filters are not applicable to the “Average resolution time” metric and the “Broadcasts” section.
6. Apply segment(s)
You can apply up to two segments to analyze specific subsets of data. Select the desired segments from the segment field if they have already been created. To create and manage segments, you can refer to this section.

Once applied, the dashboard data and charts will reflect the selected segments.
Note: If the previous period comparison is enabled, segments cannot be applied, and vice versa. To apply segments, remove the comparison.
Segments are not applicable to the average resolution rate and the broadcast section.
Create and manage segments
Note: These features and configurations are available only to users with the appropriate permissions. For further details, refer to our Help Center article on users and permissions.
You can create new segments or edit existing ones within the dashboard.
Create a segment
💡 Tip: Save filters as segments
If you’ve already applied filters and want to reuse the same setup later, you can save them as a segment. This lets you quickly reapply the same view without rebuilding conditions.
You can follow the steps here to create a segment:
- In the tool bar, click “Segment”
- A drop-down menu will appear
- Click “Manage” and a pop-up modal will appear
- Click “Create segment” and a dialog will appear
- Enter the segment name. Please make sure to enter a name that is easy for you and your team to recognize

- Add all the conditions to define the segment

- Once you have finished filing in the required fields, you can choose to create and apply it directly to the Analytics Dashboard, or choose to create the segment only without applying it to the Dashboard
Manage existing segments
You can follow the steps below to edit or delete existing segments:
- In the tool bar, click “Segment”
- A drop-down menu will appear
- Click “Manage” and a pop-up modal will appear

- You can choose to edit or delete an existing segment:
- To edit a segment, click on the
 to edit the name, or the filters applied in the segment
- Once you have finished editing, click “Save” to apply the changes
- To delete a segment, click on the
 icon
icon- A pop-up window will appear. Click “OK” to confirm the deletion
- To edit a segment, click on the
7. Reset all filters and settings
To reset all applied settings (e.g., “Date range”, “Compare previous period”, “Segments”, “Group by”,”Working hour” and “Filters”), click the “Reset” button on the toolbar.

This will restore the dashboard to its default state.
Note: The “Reset” button will not be enabled if there is no filter or settings applied.
8. Export data
Note: These features and configurations are available only to users with the appropriate permissions. For further details, refer to our Help Center article on users and permissions.
You can export the dashboard data in .CSV format for further analysis.
You can follow the steps below to export your data to a .CSV format:
- Select the date range of the data you want to export
- Click the “Export” button on the top right corner of the page
- Download process will begin
- Once completed, the .CSV file will be available on your computer
The exported data will include all the metrics available in the dashboard, aggregated by day, providing a comprehensive view for your analysis needs.
Note: Only the date range, working hours, and filters are applied in this section. “Segments,” “Comparison period,” and “Group by” settings will not be included in the exported .CSV file.
Data refresh
SleekFlow updates your Conversation Analytics data three times a day to ensure you’re viewing the most recent insights. The latest data refresh timestamp is shown at the top left corner of the dashboard.

This timestamp reflects your Company timezone settings and shows up to which point your data is complete.
Scheduled refreshes occur at approximately 2AM, 12PM, and 7PM (server local time). Completion of updates may take up to 1–1.5 hours, and actual timing may vary based on system load.
As the server location may differ from your company’s location, use the on-screen timestamp as the most reliable indicator of data freshness.
To check your server location:
After signing in, hover your mouse pointer over the SleekFlow logo at the top left corner. You will see the name of the server that is hosting your account.